| |
Tennessee county profiles provide insight into child well-being across the state
Published May 16, 2023; 1:35 p.m.
County Profiles of Child Well-Being in Tennessee provide in-depth county-level data and rankings on child outcomes related to economic well-being, education, health, and family and community
NASHVILLE, TN -- The Tennessee Commission on Children and Youth has released its County Profiles of Child Well-Being in Tennessee for 2023. The profiles include county-level measures on 52 indicators and county ranks in important areas affecting child development: economic well-being, education, health, and family and community. Each profile provides an analysis of the county’s strengths and challenges and policy recommendations to improve outcomes.
Though the profiles are released annually, the 2023 County Profiles in Child Well-Being use several new indicators in the county ranks, so they are not comparable to previous years’ ranks. Newly included are child care cost burden, severe housing cost burden, chronic absenteeism, food insecurity, the percent of children in single parent families and the number of victims of abuse or neglect.
Data is primarily from 2021 and 2022. Some indicators show substantial volatility year to year, especially in rural counties with fewer people where small changes in actual numbers of events can cause large changes in rates, though reducing that variability was one of the goals of changing some of the indicators
Key indicators include:
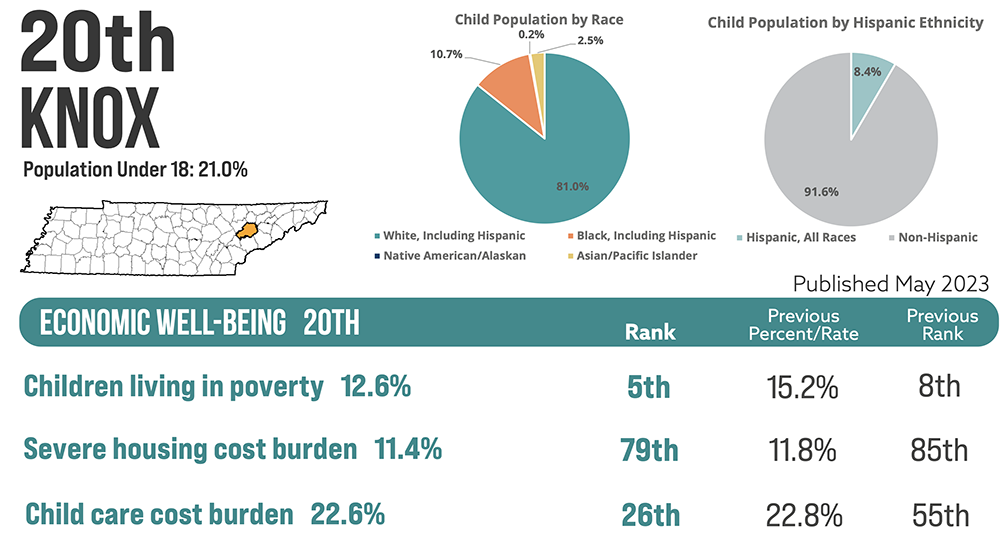
• Statewide 18.4 percent of children were living in poverty in 2021. The lowest percentage was in Williamson County (3.9 percent) and the highest percentage was in Hancock County (42.6 percent).
• Child care cost burden, defined as child care costs for a household with two children as a percent of median household income, is 23.9 percent in Tennessee. The county with the highest child care cost burden is Lake at 40.1 percent and the lowest is Williamson at 11.9 percent.
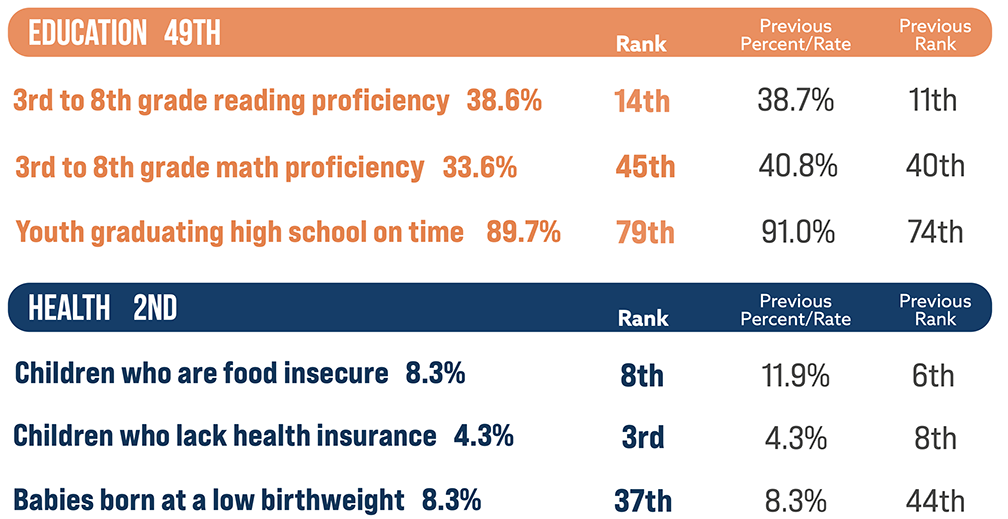
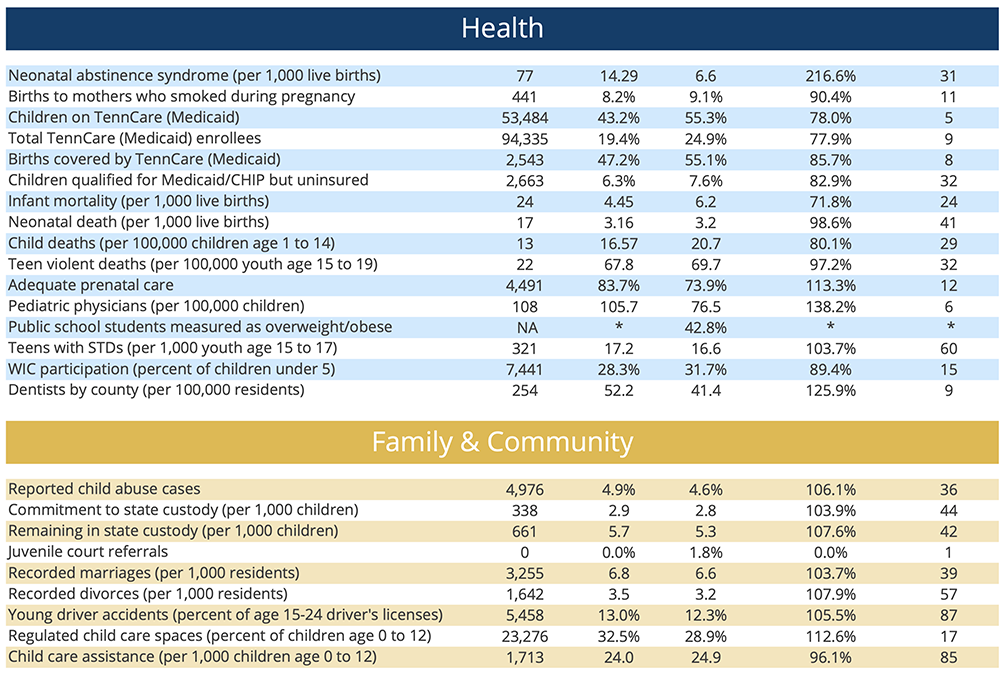
• Across Tennessee 6.0 percent of children were uninsured in 2020, an increase from 2019. The lowest rate was 4.1 percent in Sullivan County. The highest was in Pickett County, where they experienced an increase from 6.9 percent in 2019 to 10.1 percent in 2020.
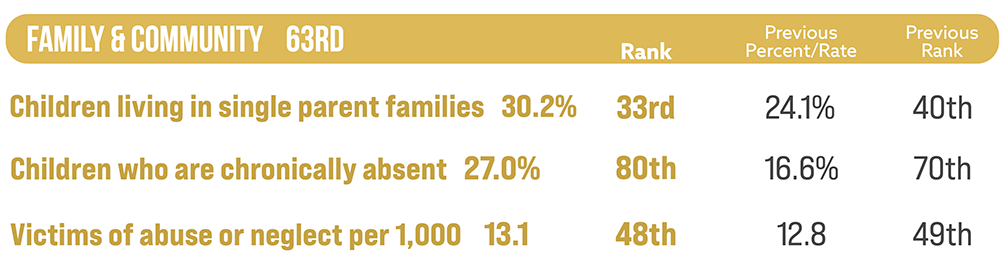
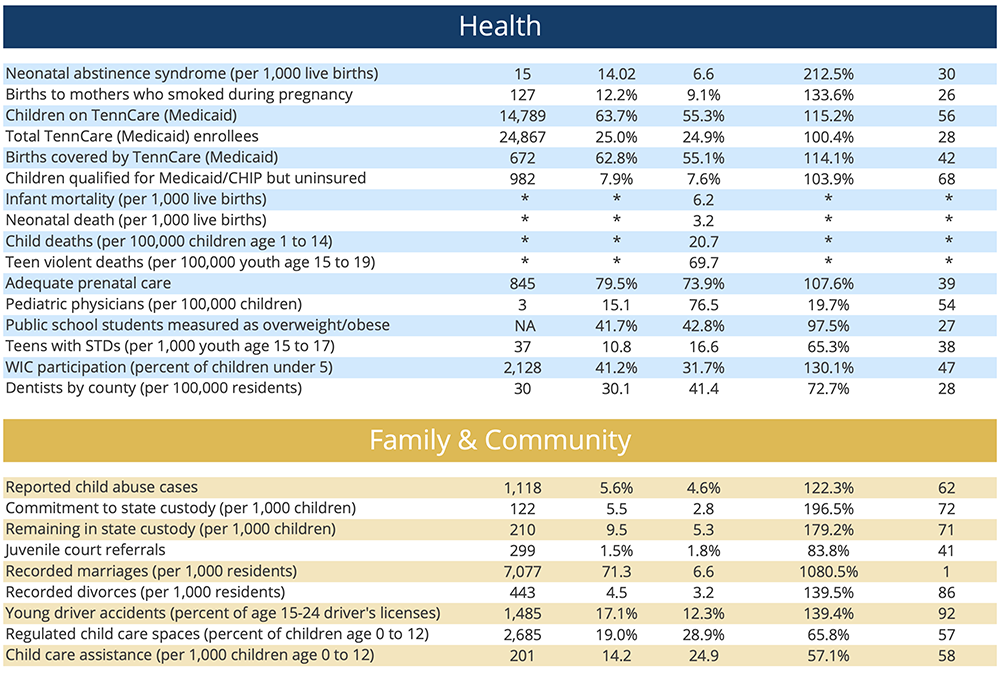
• Tennessee’s rate of children who were victims of abuse or neglect was 10.2 per 1,000 in 2021. Clay County had the highest rate at 33.9 and Moore County had the lowest at 0.8 per 1,000.
Comparing data across counties provides a glimpse into the varying needs of each county and the considerably different experience, access to resources and supports a child may have in one county compared to another. Comparing the strongest performing counties to those facing the greatest challenges shows differences that are often more than a factor of 10. A child in the lowest performing county is half as likely to be proficient in TCAP Reading than the state average. A child in Perry County is almost 10 times as likely to be chronically absent from school than a child in Blount. In the five counties with the highest rates of abuse or neglect, we see rates of greater than 28 per 1,000.
Though some counties perform better in comparison to the others in child care cost burden, this indicator is a major challenge for all of Tennessee. The U.S. Department of Health and Human Services defines affordable child care as 7 percent of a household’s income. With a state average of 23.9 percent, and the best performing county at 11.9 percent, affordability is a challenge for every county in Tennessee.
"As an agency, we are always working to improve the well-being of children, youth and families across the state,” said Richard Kennedy executive director of Tennessee Commission on Children and Youth. "These county profiles always serve as a reminder that the experience, opportunities, and access to positive outcomes can look vastly different for each child in Tennessee."
The counties ranked in the top 10 are Williamson, Wilson, Sumner, Rutherford, Blount, Moore, Weakley, Cheatham, Smith and Decatur. The counties with the greatest opportunities for improvement are Lake, Haywood, Shelby, Hancock, Hardeman, Lauderdale, Madison, Davidson, Campbell and Grainger.
The County Profiles of Child Well-Being in Tennessee and additional information about data methodology can be found at www.tn.gov/tccy/countyprofiles.
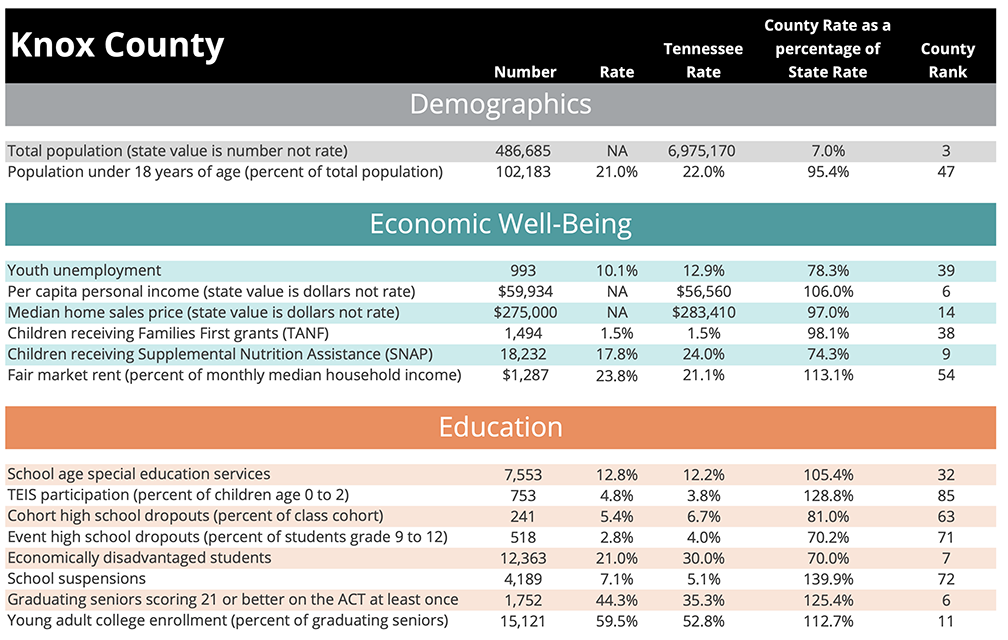
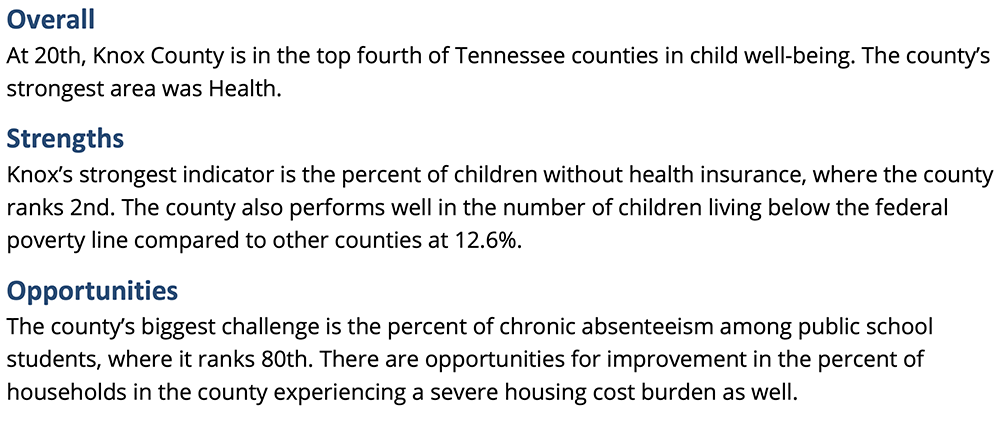
Below is Knox County's profile:
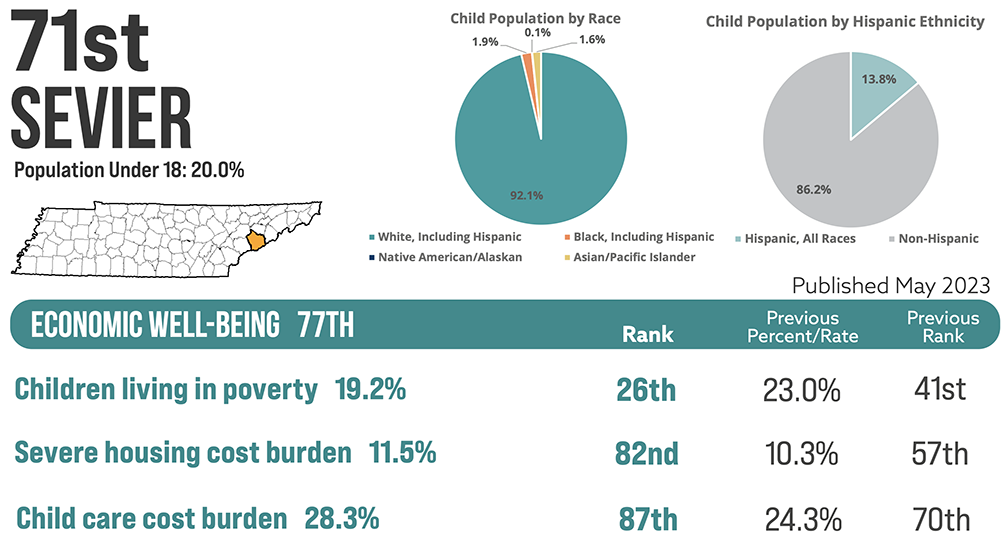
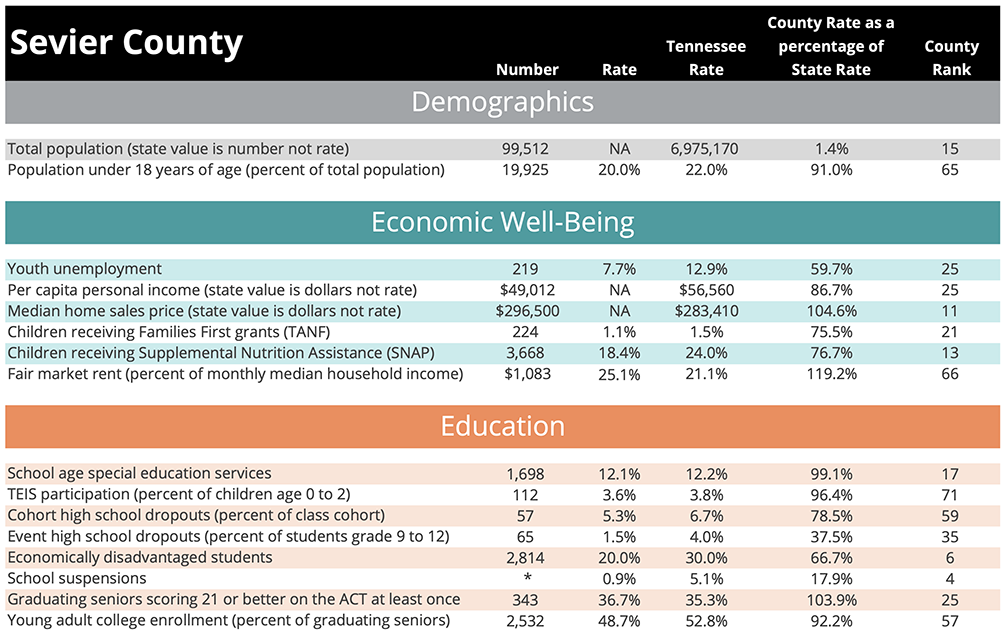
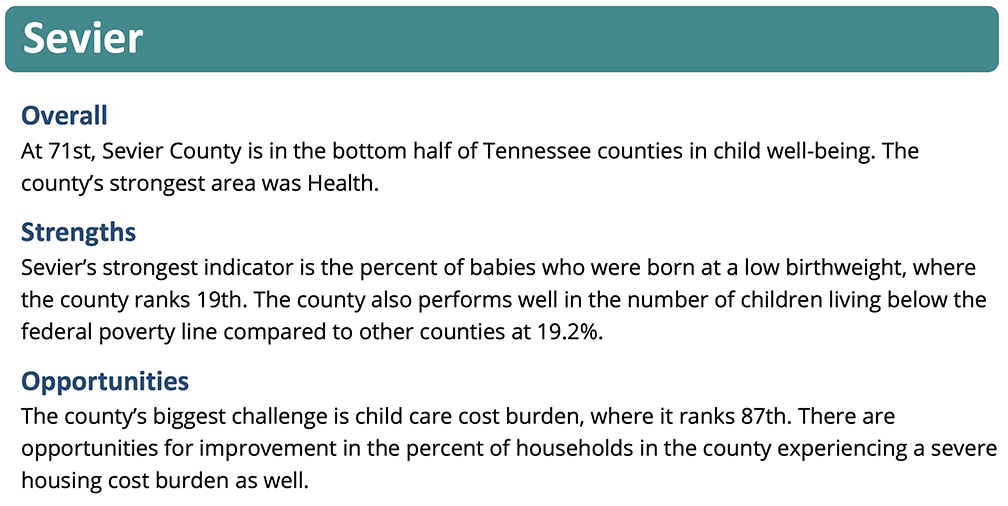
Below is Sevier County's profile:
Indicator Definitions and History
Children living in poverty - Percent of children living in a household below the federal poverty line. Source: US Census Bureau Small Area Income and Poverty Estimates (2021).
Severe housing cost burden - Percent of households spending 50% or more of their income on housing. Source: American Community Survey, 5-year estimates (2017-2021). New to the county profiles, it replaces Fair Market Rent. It is more closely aligned to a KIDS COUNT national indicator, does not apply only to rental housing, and is a rate rather than a dollar value.
Child care cost burden - Child care costs for a household with two children as a percent of median household income. Source: Produced by the University of Wisconsin Population Health Institute using The Living Wage Calculator (2022) and Small Area Income and Poverty Estimates (2021).
This is new to the rankings and replaces Median Household Income (MHI). We wanted an indicator expressed as a percentage rather than a dollar amount as well as one that related to a common family expense. Income is already somewhat measured in poverty estimates. In addition, this indicator uses MHI in its calculation.
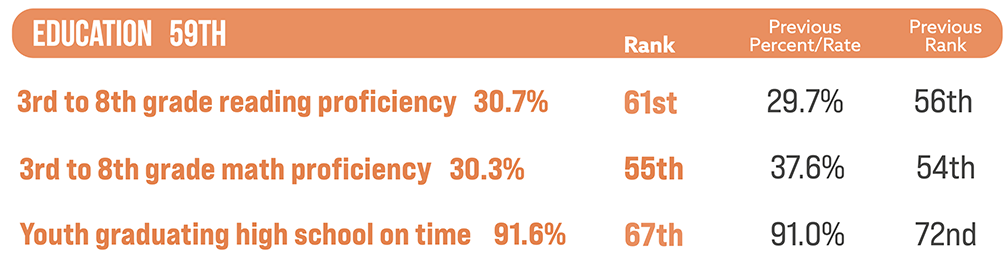
3rd to 8th grade reading proficiency - Percent of third- to eighth-grade students who scored “on- track” or “mastered” on the Tennessee Comprehensive Assessment Program (TCAP) reading and language test. Source: Tennessee Department of Education (2021-22).
3rd to 8th grade math proficiency - Percent of third- to eighth-grade students who scored “on-track” or “mastered” on the Tennessee Comprehensive Assessment program (TCAP) math test. Source: Tennessee Department of Education (2021-22).
Youth graduating high school on time - Percent of ninth-grade cohort that graduates in four years. Source: Tennessee Department of Education (2021-22).
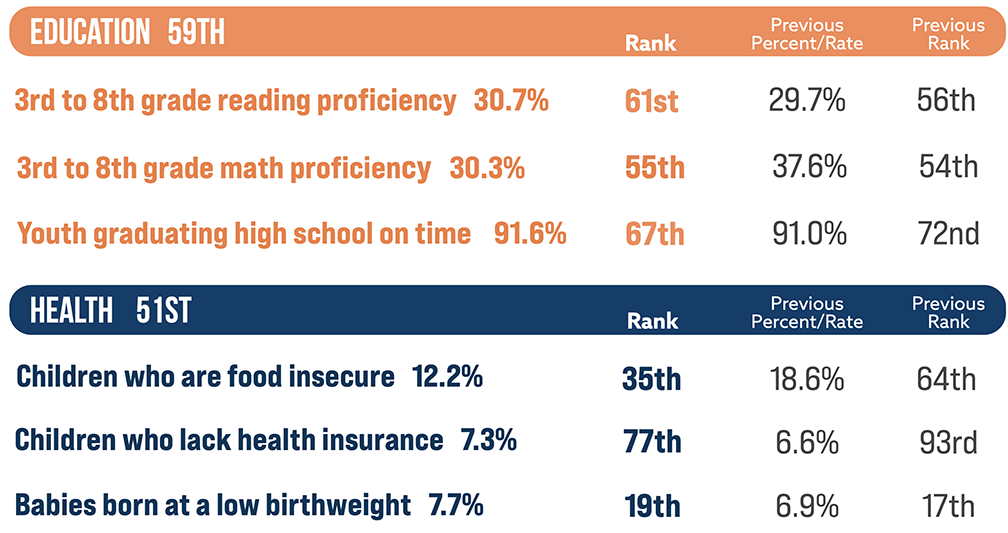
Children who are food insecure - Percent of children who sometimes lack access to adequate food. Source: Map the Meal Gap (2021). This is new to the rankings and replaces child and teen death rates, which, because the Department of Health has tightened its data suppression rules, is no longer available for all counties. We did not have an indicator for all counties to line up with overweight/ obesity data in the national ranking, so we searched for an one related to nutrition and healthy eating.
Children who lack health insurance - Percent of children who lack health insurance. Source: US Census Bureau Small Area Health Insurance Estimates (2020).
Babies born at a low birthweight - Percent of live births where baby weighs less than 2,500 grams (5.5 pounds), averaged over three years. Source: Tennessee Department of Health (2019-21), with three counties estimated using American Community Survey 5-year data (2015-19, 2016-20, 2017-21). It has been in our county profiles from the beginning, though it was previously just one-year data. The Department of Health has tightened its data suppression rules, and dozens of counties’ data were unavailable with one-year numbers. Three-year numbers still left three counties suppressed. Those were estimated from 5-year American Community Survey data.
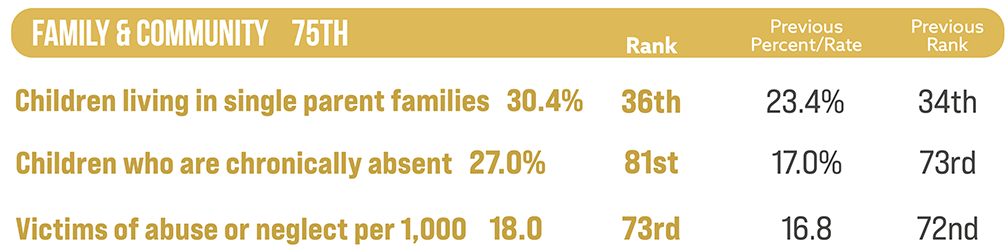
Children living in single parent families - Single-parent households as a percent of all households with children. Source: American Community Survey, 5-year estimates (2017-2021). New to the county profiles, it replaces births to unmarried females, which in turn replaced teen births. As the Tennessee Department of Health tightened its data suppression rules, teen birth data was no longer available for all counties. Children born to unmarried females was always an attempt to roughly estimate teen births using different data. In moving from actual counts to ACS 5-year estimates, we decided to use this indicator over teen births as it affects families with parents of all ages.
Children who are chronically absent - Children who are absent 10 percent or more of school days for any reason, including excused/unexcused absences and out-of-school suspensions. Source: Tennessee Department of Education (2021-22). New to the county profiles, it replaces school suspensions, which have suppressed data for many counties.
Victims of abuse or neglect per 1,000 - Child victims of abuse or neglect. In cases with multiple children each child is counted individually. The total is the number of children associated with substantiated cases of severe abuse and of determinations of “Services Court Ordered“ or “Services Needed” in cases of non-severe abuse or neglect. Children with multiple cases during the year are counted only once. The rate is per 1,000 children. Source: Tennessee Department of Children’s Services (2021). This has been in our county rankings from the beginning, but we have moved to counting children rather than cases.
About the Tennessee Commission on Children and Youth
The Tennessee Commission on Children and Youth is an independent agency created by the Tennessee General Assembly. Its primary mission is to lead systems improvement for all children, youth and families through data-driven advocacy, education, and collaboration. Information on the agency is available at www.tn.gov/tccy.
|
